

Georgia Tech
Graduate Research/Teaching Assistant | Atlanta, GA | Aug. 2020 – Present
“There is a crack in everything, that's how the light gets in.”
📢 News
I have joined the University of Central Florida (UCF) as a tenure-track Assistant Professor of Computer
Science.
I am actively recruiting self-motivated PhD students to join my lab beginning Spring
2026.
If you are passionate about data visualization, technical HCI, or
data-driven storytelling, I’d love to hear from you.
Learn more about my research, publications, and lab at
diidlab@UCF
.
I recently completed my PhD in the Human-Centered Computing (HCC) program at Georgia Tech, where I was a member of the Information Interfaces Research Group , part of the broader Georgia Tech Visualization Lab . My PhD advisor was Dr. John Stasko . Before pursuing my PhD, I worked as a sports journalist and analyst after earning a Master's degree in Electrical Engineering.
My overarching research goal is to democratize data practices, encompassing data analysis,
communication, and consumption. I pursue these interconnected objectives through a human-centric lens,
leveraging the analytical power and aesthetic expressiveness of data visualization to reach, engage, and
inform broader audiences.
My research spans information visualization, data science, human-computer interaction, and data
journalism, with a focus on three key dimensions:
(1) Designing analytical interfaces
that utilize interactive visualizations to support data exploration, enabling users to derive actionable
insights across diverse domains;
(2) Developing authoring tools
powered by Generative AI to simplify the creation of engaging and accurate data-driven content (e.g.,
visual data stories) by lowering technical barriers and enhancing expressiveness; and
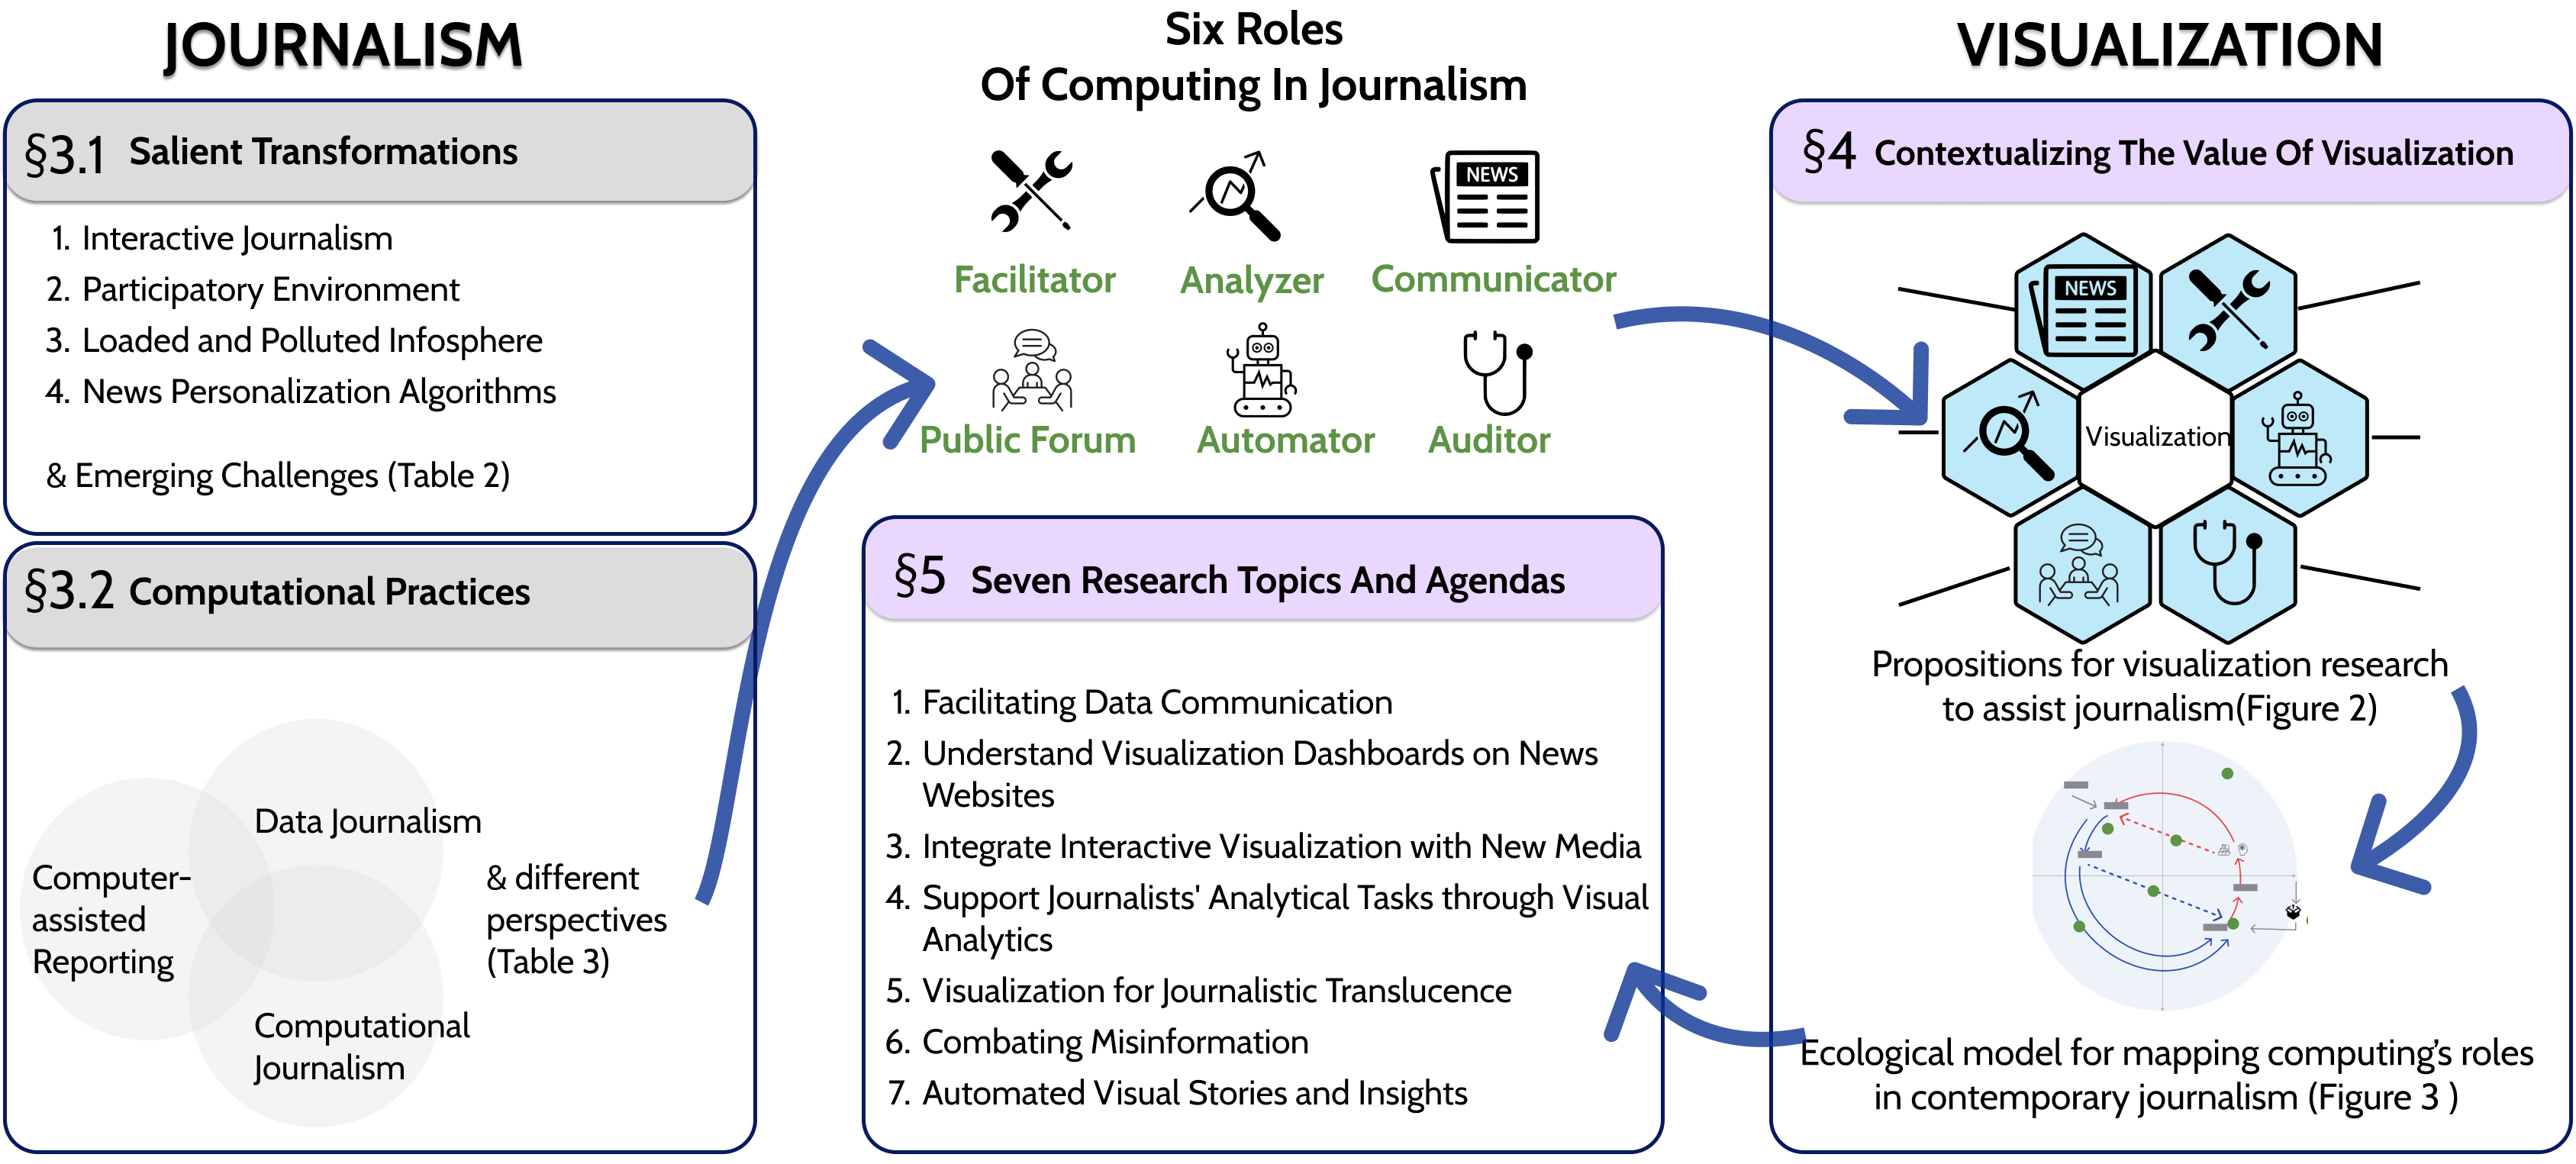
(3) Countering data-driven misinformation
by examining how flawed data narratives and visuals can mislead audiences, and designing strategies,
techniques, and tools to mitigate these challenges.


Graduate Research/Teaching Assistant | Atlanta, GA | Aug. 2020 – Present

Research Intern | Seattle, WA | May 2024 – Aug. 2024
Research Scientist/Engineer Intern | San Jose, CA | May 2023 – Aug. 2023

NBA Journalist/Basketball Data Analyst | Washington, D.C., & Houston, TX | Sep. 2015 – Aug. 2020
I am committed to fostering a dynamic and inclusive learning environment, where students gain both theoretical knowledge and practical skills in data visualization, human-computer interaction, and data analytics.
Terms: Spring 2023, Spring 2024, Spring 2025
Terms: Fall 2023, Fall 2024
Terms: Spring 2021
Terms: Fall 2020
some are for papers, most are for fun...
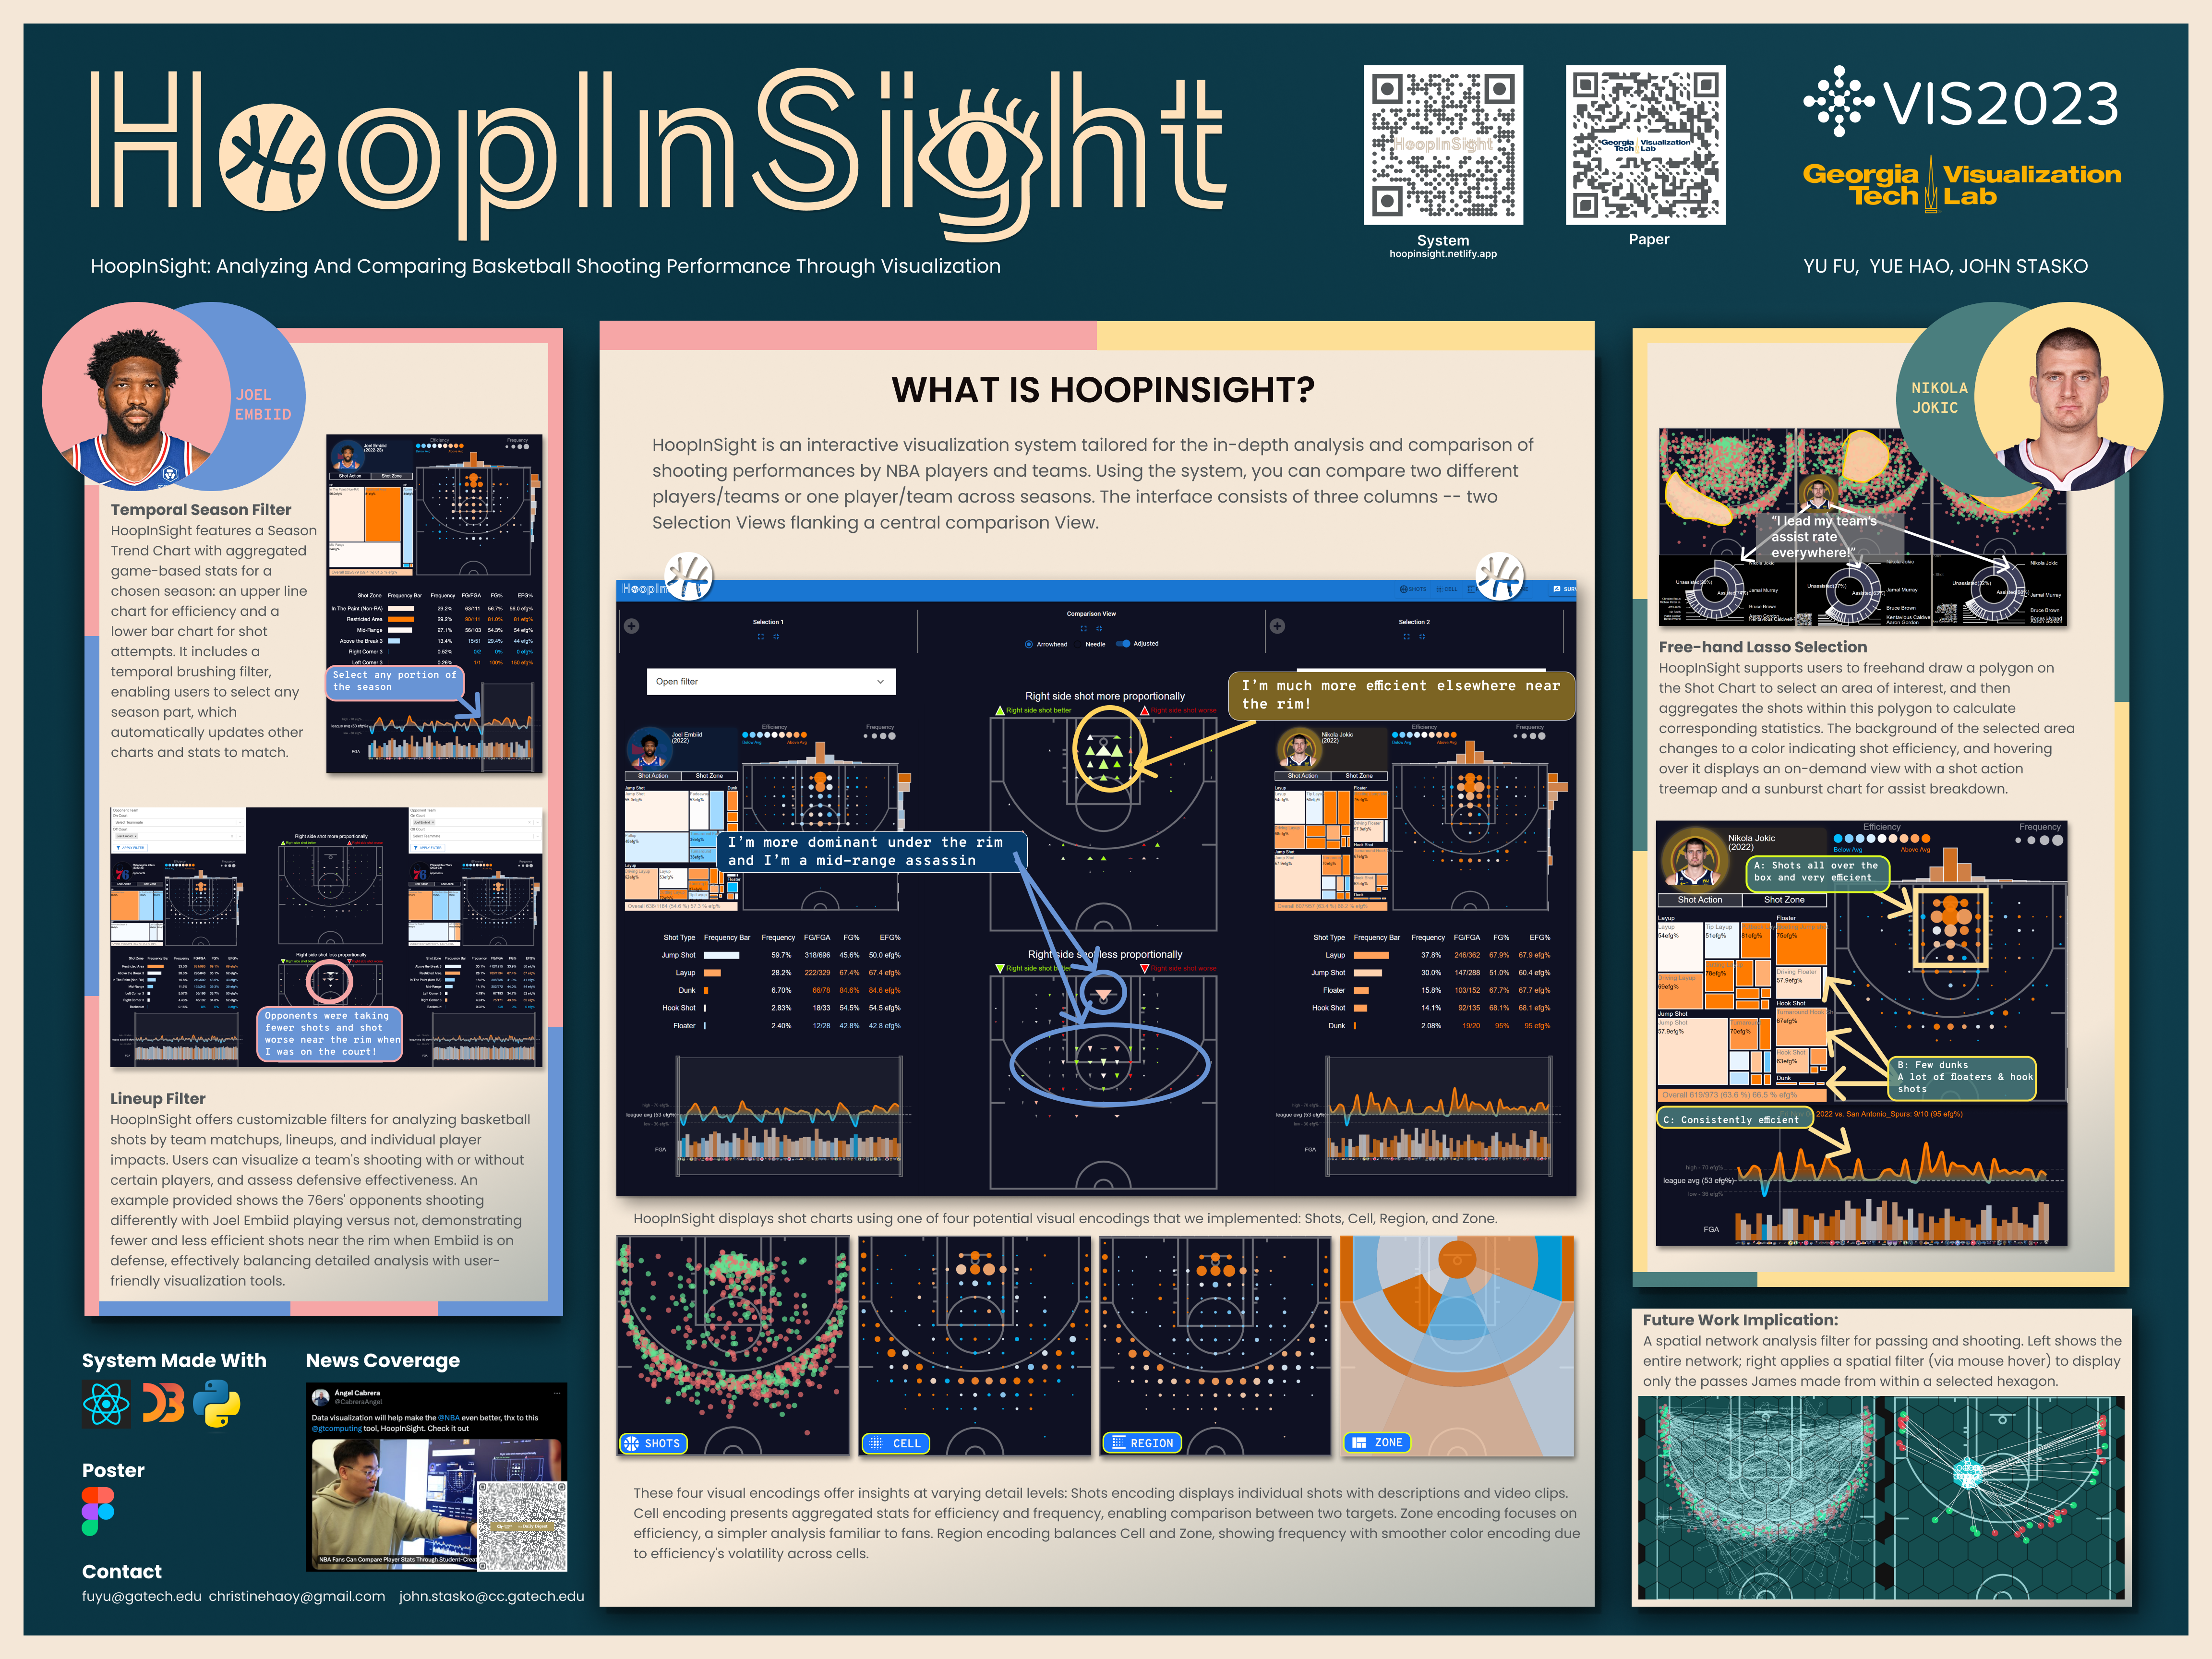
interactively visualizing NBA game information and advanced statistics to support novel
narrative construction and insight communication.
interactively visualizing NBA teams' lineup performance, with emphasis on advanced statistics
and playing time
interactive visualization interface that animates teams' traveling routes
Participatory design project w/ ShotQuality.
Unfinished participatory design project w/ BBallIndex.
It focuses on showing different advanced statistics generated by BBallIndex for each player.
SongBridge allows users to compare multiple playlists and visualize the connections and similarity between them.